Data Centers Are the Most Comment-Heavy Subject in Local Government — and the Fastest-Growing
In eleven months, data centers went from a topic almost no local government mentioned to one that generates more comment threads per post than anything else we measure. We found 1,030 posts about data centers from 422 U.S. city and county governments inside 1,129,315 public Facebook posts — and the volume nearly tripled over the window while the number of governments talking about them grew six-fold. This is what local government is actually saying, what residents are actually asking, and which approaches are holding up in the comment section.
- The steepest-rising land-use topic we track. Holding the same 3,995 governments constant, data-center posting went from 54 per 100,000 posts (Sep–Nov 2025) to 141 (May–Jul 2026). Governments posting about them rose from 34 to 211.
- Nothing else draws comments like this. 25.4% of data-center posts draw 25+ comments, against 3.3% of everything else — and 8.9% draw 100 or more, against 0.6%. The average data-center post collects 28.7 comments versus 4.1.
- Governments are convening, not celebrating. The most common mode is education — town halls, panels, FAQs (52.6% of posts) — ahead of process and hearings (42.7%) and new rules (37.0%). Economic-development announcements are just 24.2%, and restrictions like moratoria appear in 16.7%.
- Water is the number-one concern named (16.2% of posts), ahead of electricity and the grid (11.7%), taxes (11.0%), and property values (10.0%).
- It is a county story and a large-government story: 15.5% of counties have posted about data centers versus 6.9% of cities, and 17.0% of governments over 50,000 versus 3.9% of towns under 10,000.
In this report: How fast it arrived · The comment load · What governments actually say · What residents ask about · Where it’s happening · Six approaches, in the wild · What holds up · How we measured it
How fast it arrived
Data centers are not a new industry, but as a subject of municipal communication they are close to brand new. Through late 2025 a few dozen governments mentioned them. By mid-2026 it was a standing agenda item across the country.
The rate roughly tripled, and June and July 2026 are the two steepest months in the series. The count of governments involved moved even faster: 34 governments posted about data centers in September–November 2025; 211 did in May–July 2026. This is not a handful of hotspots getting louder — it is the topic spreading to new communities.
The comment load: this is the most contentious thing on the page
We have measured the comment behavior of a lot of local-government content — elections, misinformation corrections, comments-off policies, video. Data centers are in a category of their own.
A quarter of all data-center posts draw a thread of 25 or more comments — nearly eight times the rate of ordinary government content. Almost one in eleven crosses 100 comments, a threshold that ordinary posts hit roughly once in 170. For comparison, the direct rumor corrections we studied recently — already an unusually discussed category — draw 25+ comments 12.6% of the time. Data centers double that.
They also travel. Data-center posts earn a median of 21 interactions against 6 for everything else, get shared 68.0% of the time versus 57.0%, and against a government’s own typical post they run at 2.52× the page median, with 61% beating it.
What governments actually say
We classified all 1,030 posts by what the government was doing. Categories overlap — a single post often announces a hearing and explains an ordinance.
The shape here is worth sitting with. If you assumed local governments were mostly out cutting ribbons on billion-dollar investments, the data says otherwise: the announcement frame is the fourth-most-common thing they do. What they are mostly doing is convening — hosting the panel, publishing the FAQ, posting the hearing date, explaining the ordinance. And a meaningful minority are publishing restrictions: 172 posts referenced a moratorium, a ban, or removing data centers as a permitted use.
What residents ask about
Because so many of these posts exist to answer questions, the posts themselves are a decent readout of what communities are worried about. We tagged which issues each one raises.
Water leads — it appears in 16.2% of all data-center posts, more often than electricity, taxes, or property values. That is a useful corrective for anyone assuming the fight is mainly about power. Temple, Texas listed its residents’ questions explicitly in one post: “water, electricity, land use, traffic, noise, environmental review, tax abatements, and the City’s role in the process” — which is very nearly this chart in sentence form.
Note what is small. Jobs appear in only 6.3% of posts, and farmland in 3.8%. The economic case is not the center of gravity in this conversation; resource use is.
Where it’s happening
Pennsylvania leads on raw volume (133 posts), followed by Virginia (114), North Carolina (74), Texas (65), New Jersey (52), and Michigan (51). Virginia’s presence is unsurprising given its existing concentration of facilities; Pennsylvania’s reflects a wave of newer proposals.
Two structural patterns:
- Counties, not cities. 15.5% of counties in our corpus have posted about data centers, against 6.9% of cities. Siting decisions on large parcels usually sit with county boards.
- Bigger governments, so far. 17.0% of governments over 50,000 have posted about them, versus 9.6% of mid-size and just 3.9% of towns under 10,000 — though the fastest growth is in the spread to new, smaller places.
The single most active government in our data is Botetourt County, Virginia, with 27 posts in eleven months — effectively a running public file on one proposal.
Six approaches, in the wild
Screenshots are the live Facebook posts; the engagement figures quoted are the ones visible on each post. Click any to open the original.
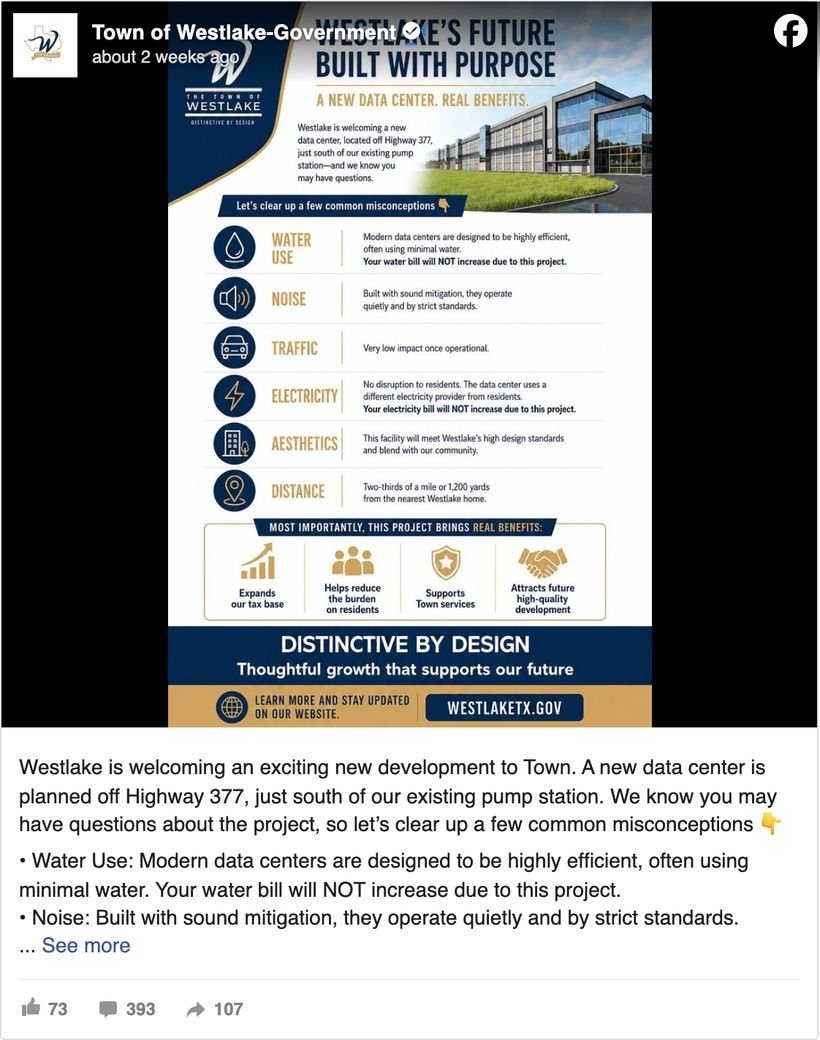
“Westlake is welcoming an exciting new development to Town.” The post drew 393 comments against 73 reactions — more than five comments for every reaction, on a page whose typical post barely registers. When the celebratory frame meets an unconvinced audience, the comment section becomes the correction.
The lesson isn’t “don’t announce.” It’s that an announcement with no answers attached leaves residents to supply the questions themselves.
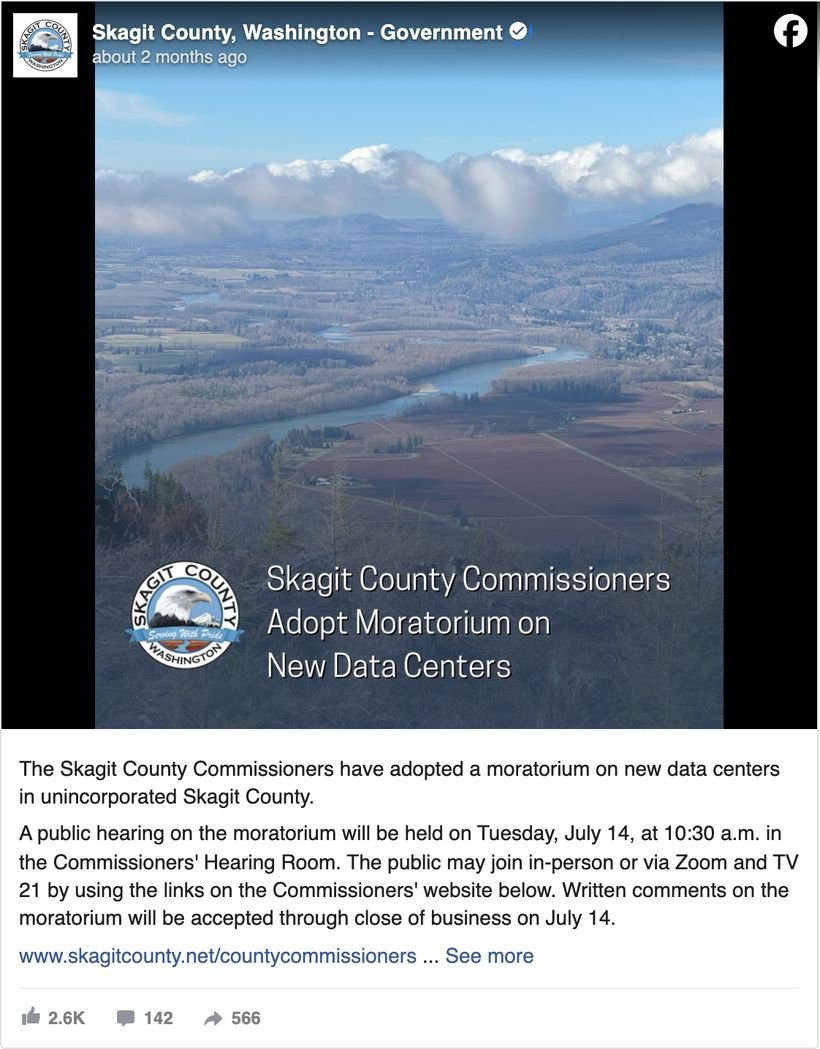
A plain announcement that commissioners adopted a moratorium on new data centers in unincorporated areas: 2.6K reactions, 142 comments, 566 shares — roughly 360× this page’s typical engagement. Restriction posts are the most-shared subtype we found: residents forward them the way they forward a boil-water notice.
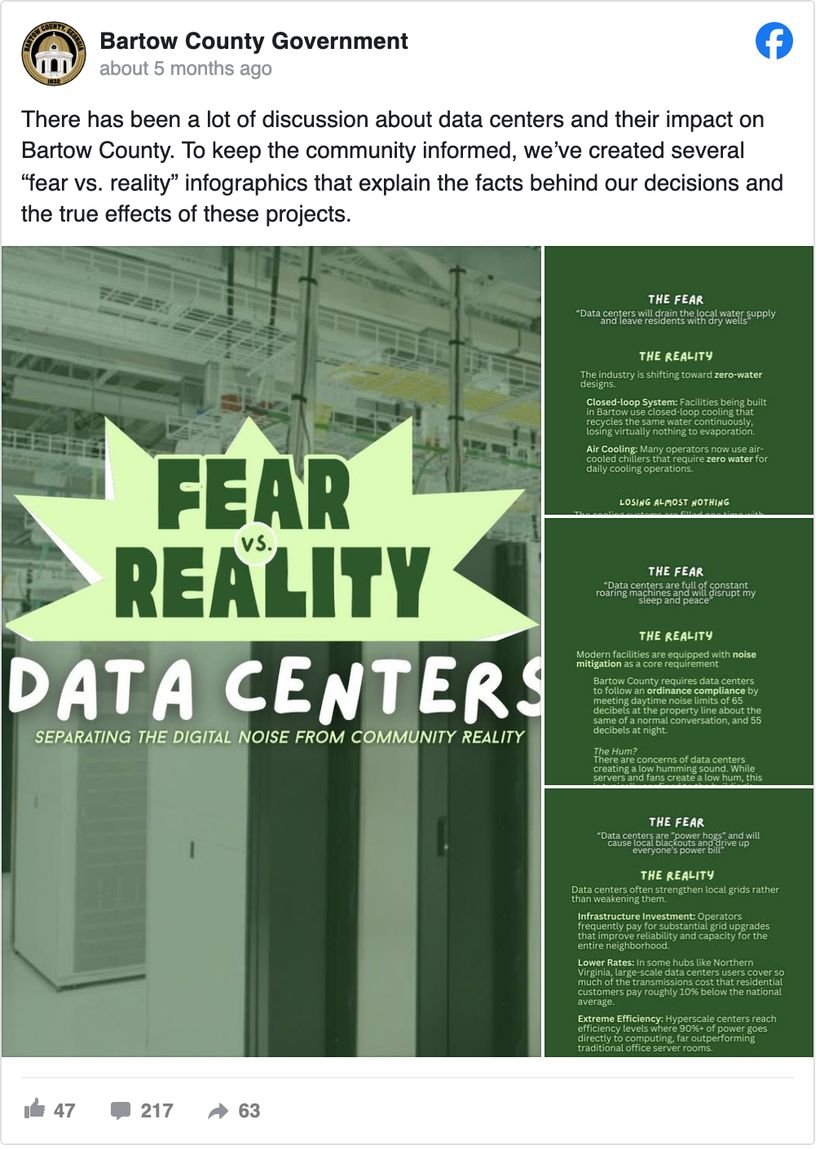
A “Fear vs. Reality” infographic series taking the concerns one at a time — water supply, noise, power — with specifics attached (closed-loop cooling, a 65-decibel daytime ordinance limit). 217 comments, 63 shares. Note that it maps almost exactly onto the top three issues in our concern chart.
Worth noting the posture: the county has clearly taken a side, and framing residents’ questions as “fears” is a choice. It is a persuasion document, not a neutral one — effective, but not the same thing as a briefing.
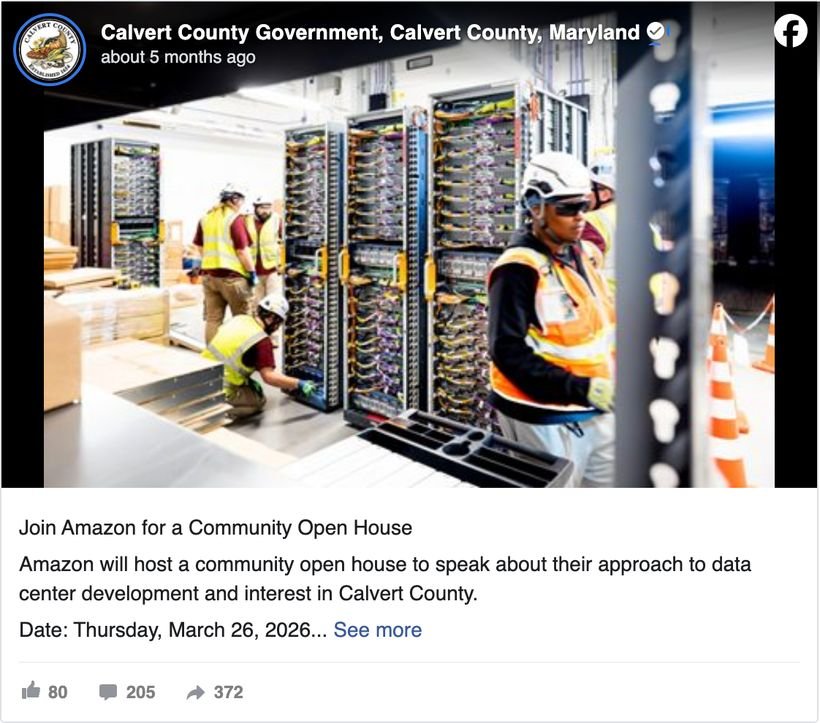
Rather than speaking for the developer, the county publicized an open house where Amazon would answer directly: 205 comments, 372 shares. The county followed up weeks later with a second post answering the recurring questions in writing. Convening plus a written follow-up is the most repeatable pattern in this whole dataset.
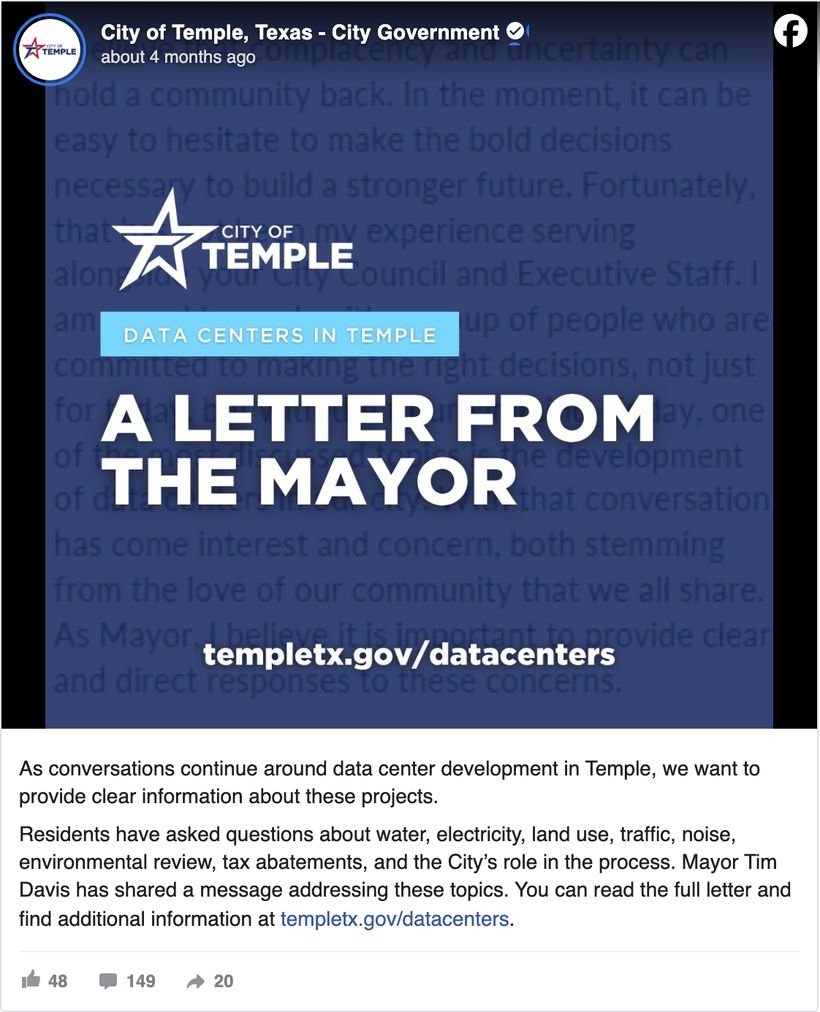
Temple listed the questions residents had actually asked — water, electricity, land use, traffic, noise, environmental review, tax abatements, and the city’s own role — then routed everything to a single standing page, templetx.gov/datacenters. 149 comments. Naming the hard questions out loud is what separates this from a press release.
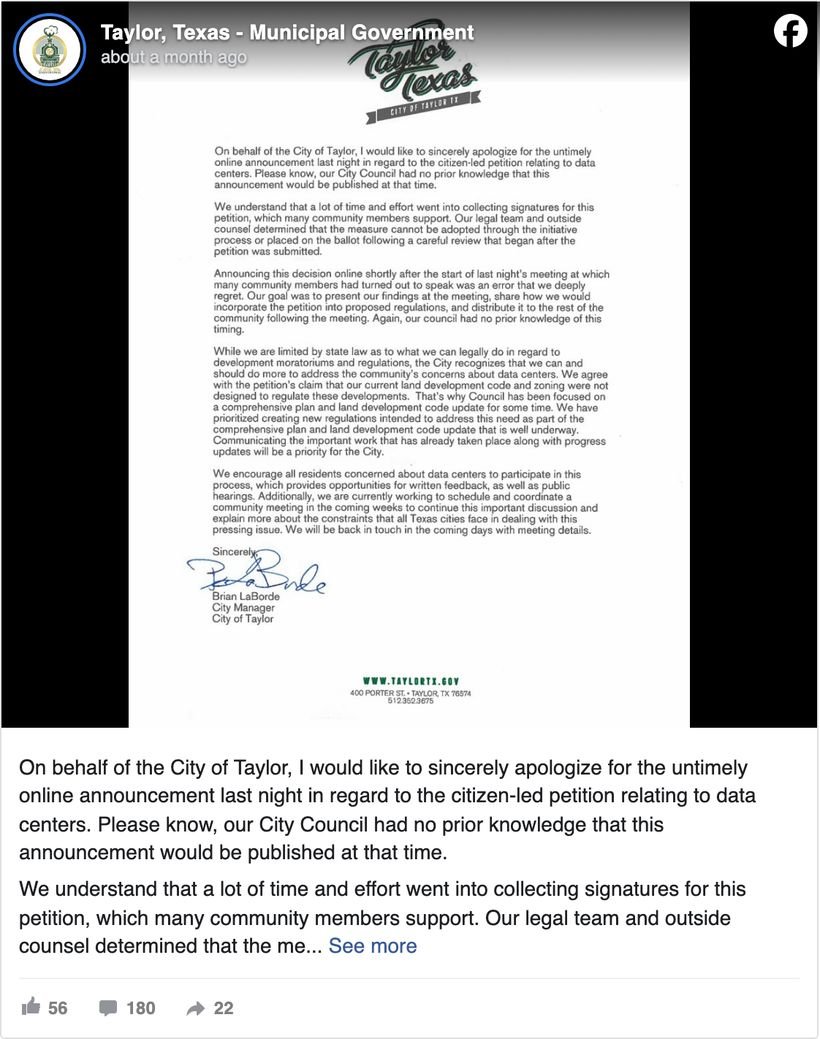
“I would like to sincerely apologize for the untimely online announcement last night…” — a public apology for how a data-center announcement reached residents, drawing 180 comments. It is the clearest illustration in the dataset that on this subject, when and how residents find out is itself the story.
What holds up
Reading across all 1,030 posts, a few practices recur in the ones that appear to land — meaning they get forwarded, and their comment sections stay substantive rather than purely oppositional. None of this is a formula, and communities differ; treat it as what peers are doing, not as a promise.
- Publish before you are asked. The governments with the calmest threads are generally the ones already posting hearing dates, draft ordinances, and FAQs before a specific project is controversial. The 9.4% of posts that exist to correct rumors are, in effect, the cost of not having gone first.
- Lead with water. It is the single most-named concern. A post about a data center that does not address water is answering the second question before the first.
- Convene rather than speak for the developer. The Calvert County pattern — put the company in the room, then publish the answers in writing afterwards — lets the government stay the honest broker rather than the advocate.
- Give it one permanent home. Temple’s templetx.gov/datacenters is the model: a standing page every post can point to, so the record accumulates instead of scattering across a feed.
- Separate what you decide from what you don’t. Several of the clearest posts spell out precisely which approvals sit with the local body and which sit with a state agency or utility. Residents direct their energy far more usefully when the jurisdictional map is explicit.
- Staff the comment section. A quarter of these posts become 25+ comment threads. That is a foreseeable workload, and the governments handling it well are answering in-thread rather than letting it run.
How we measured this
Every figure comes from public posts any resident could see.
Frequently asked questions
How many local governments are posting about data centers?
422 of 4,963 U.S. city and county governments — 8.5% — posted about data centers between September 2025 and July 2026, producing 1,030 posts. Participation is concentrated among counties (15.5%, versus 6.9% of cities) and larger governments (17.0% of those over 50,000, versus 3.9% of towns under 10,000). The number of governments posting about them grew from 34 in September–November 2025 to 211 in May–July 2026.
Do data-center posts get a lot of comments?
More than any other subject we measure. 25.4% of data-center posts draw 25 or more comments, against 3.3% of ordinary local-government posts, and 8.9% draw 100 or more, against 0.6%. The average data-center post collects 28.7 comments versus 4.1 for everything else. They are also shared more (68.0% versus 57.0%) and earn a median of 21 interactions versus 6.
What do residents worry about most with data centers?
Water. It appears in 16.2% of all data-center posts — more than electricity and the grid (11.7%), taxes and revenue (11.0%), property values and neighborhood impact (10.0%), or noise (8.7%). Jobs appear in only 6.3%, which suggests the economic case is not what the conversation is actually about.
How should a city or county communicate about a proposed data center?
The patterns that recur among peers: publish hearing dates, draft ordinances and FAQs before a project becomes contentious; address water first, since it is the most-named concern; convene the developer rather than speaking for them; keep one permanent page that every post links to; state plainly which decisions are local and which belong to a state agency or utility; and plan for moderation, because a quarter of these posts become substantial comment threads.
Are most governments announcing data centers or restricting them?
Neither is the main activity. Education — town halls, panels, FAQs and explainers — is the most common mode at 52.6% of posts, followed by process and public hearings (42.7%) and new rules and ordinances (37.0%). Economic-development announcements account for 24.2%, and 16.7% of posts reference a restriction such as a moratorium, a ban, or removing data centers as a permitted use.
Read what peers published before you write yours.
Search real data-center posts, moratoria, FAQs and hearing notices from 5,000+ governments — by keyword, state, and population band.
“An exceptional way for people to look for ideas and comparisons.”