What should we post this month?
Most local-government content calendars are built from habit and whatever the departments send over. That’s not a criticism — it’s what happens when one person covers communications for a whole community. But we can now answer the question with evidence: 1,142,010 public Facebook posts from 4,964 U.S. city and county governments over the last twelve months, measured the same way for every account. Here is the shape of a month that works, with the numbers and real examples behind it.
- Shift the mix, don’t add volume. The four weakest topics eat 37% of the average calendar; infrastructure — the single most-forwarded topic — gets just 8.5%.
- Post about the work residents can see: road and water projects, public safety, events. These are the workhorses at every community size.
- Volume has a ceiling. Engagement holds steady up to ~30 posts a month, then falls off — past ~45, a small town loses half its per-post engagement.
- The weekend is wide open. Saturday and Sunday carry 11.8% of all posts and out-earn every weekday.
In this guide: The topic mismatch · What good looks like · How much to post · The weekend gap · A month that works · Where these numbers come from
The topic mismatch is the biggest lever you control
Rank every content topic by how it actually performs, then line that up against how much of the calendar it gets. The two columns point in opposite directions.
Infrastructure & Planning is the standout. It ties for the highest median engagement and it is the most-forwarded topic in local government: 68% of infrastructure posts earn at least one share, and the median infrastructure post gets 2 shares — the only topic above one. Road work, water main projects, construction phases, detours. This is the content residents treat as genuinely useful and pass to their neighbors. And it sits at 8.5% of the average calendar.
Public Safety and Events & Community Activities match it on engagement and are already well supplied — those are your workhorses, keep them.
At the other end, Government Information & Boards (meeting notices, agendas, procedural announcements) and Other/Miscellaneous together take 30% of the calendar while sitting at the bottom on engagement. In towns under 10,000, Other/Miscellaneous alone runs to 23% of everything posted.
You do not need to post more. You need to move a few posts a month from the bottom of that chart to the top.
What good looks like
Four real posts from the corpus — each one an ordinary government doing an ordinary thing well. Screenshots are the live Facebook posts; click any of them to see the original.
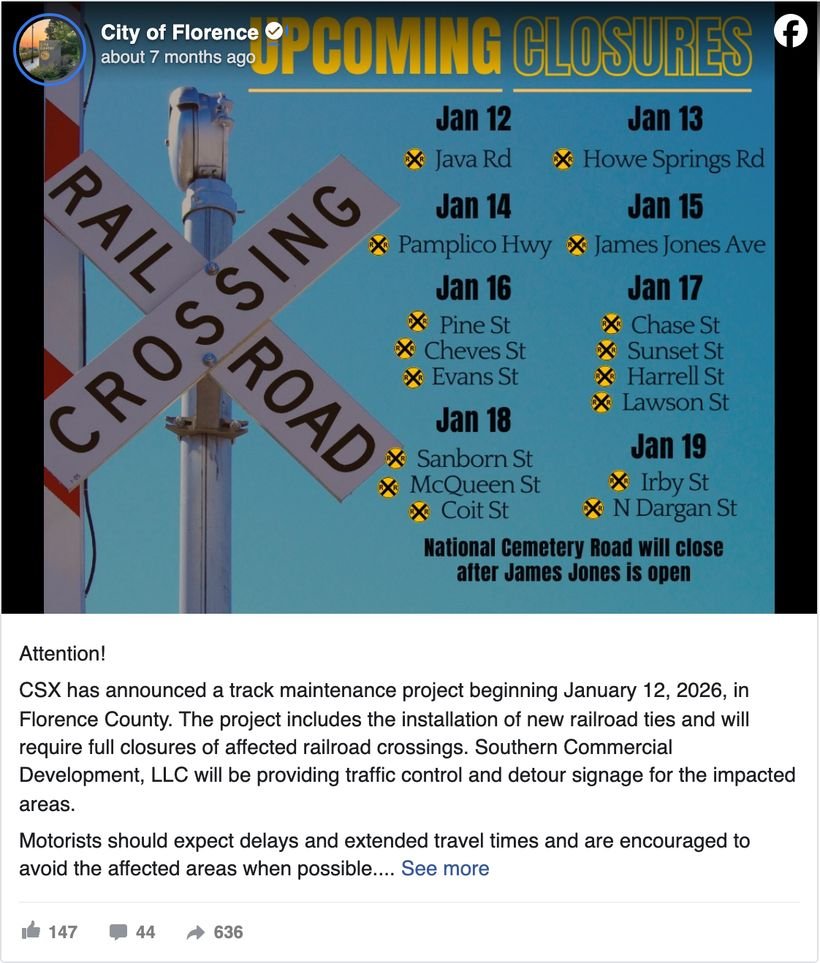
Florence County, South Carolina announced a CSX track-maintenance project: the dates, the crossings affected, what to expect. It earned 636 shares against 147 reactions — four times more forwarding than liking — on a page whose typical post earns 13 interactions.
Why it works: it answers “will this affect my commute?” before anyone has to ask. Dates, locations, specifics.
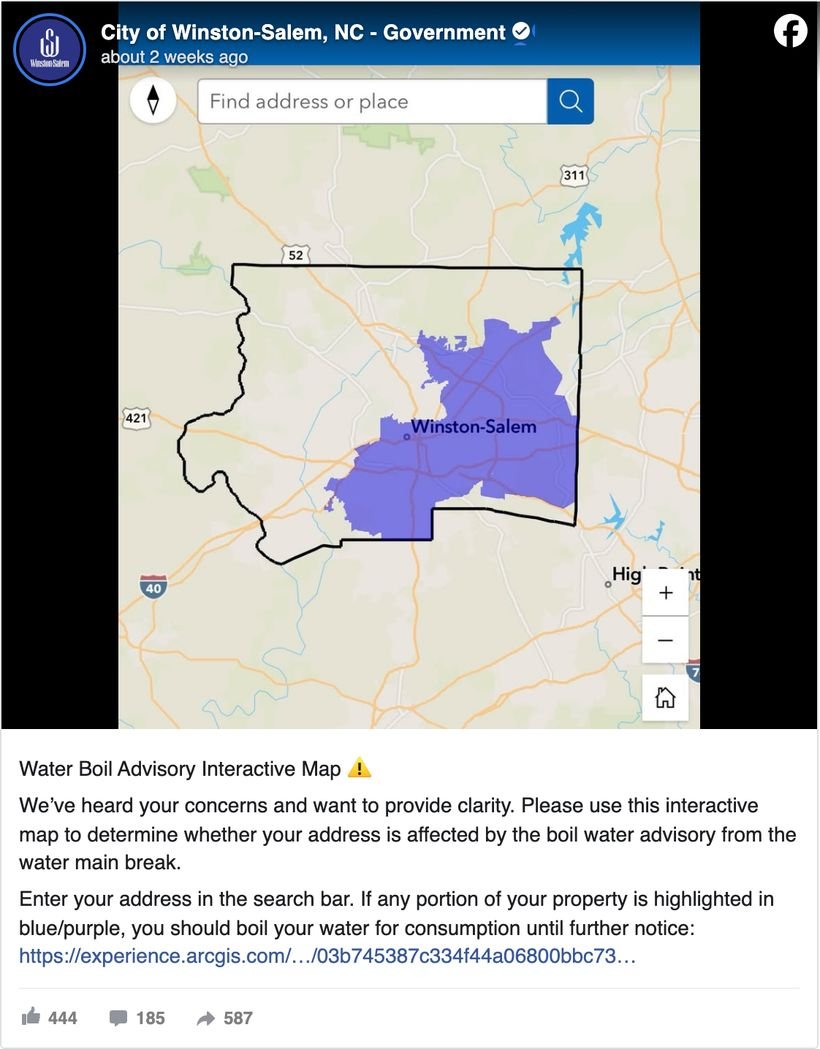
Instead of another text advisory, Winston-Salem, North Carolina posted an interactive boil-advisory map: “Enter your address in the search bar. If any portion of your property is highlighted…” It earned 587 shares on a page with a median of 34 interactions.
Why it works: it opens with “we’ve heard your concerns and want to provide clarity,” then hands residents something they can act on themselves.
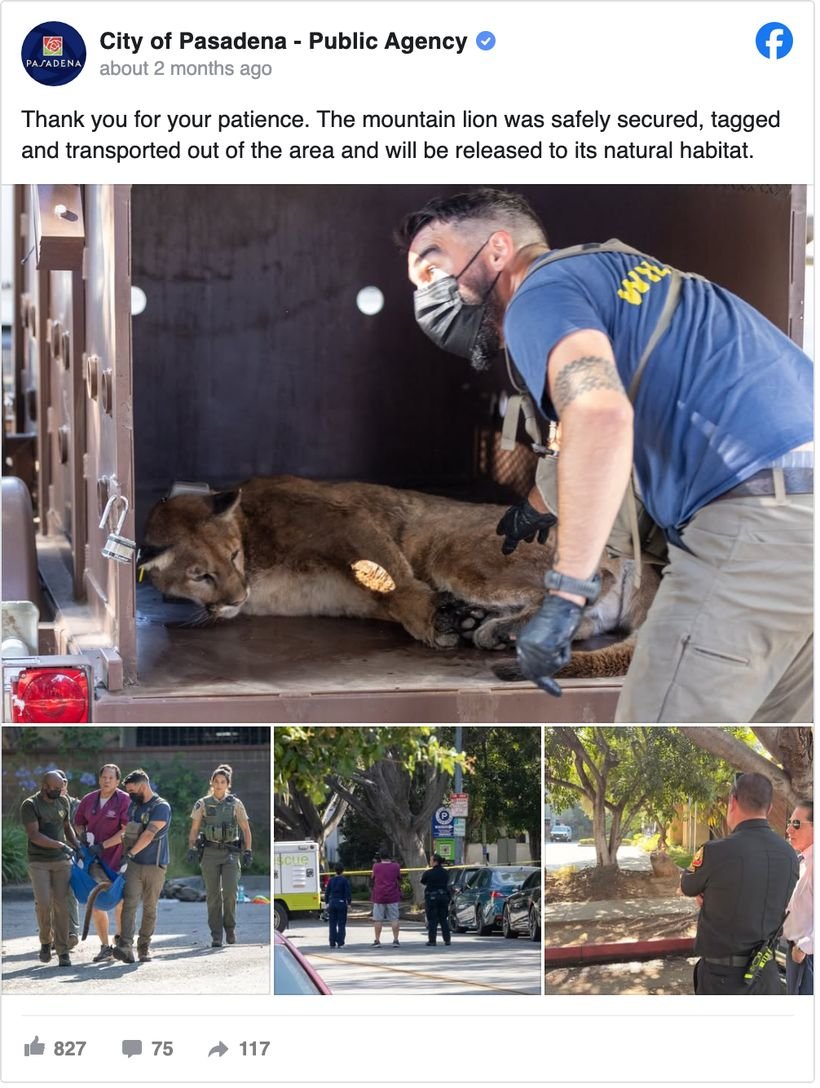
Posted on a Saturday, Pasadena, California closed the loop on a wandering mountain lion with photos and a one-line resolution: “safely secured, tagged and transported out of the area.” 827 reactions on a page whose median post earns 3.
Why it works: it resolves something residents were already talking about, on the day they had time to read it.

Lewiston, Idaho turned property taxes — the least glamorous topic in local government — into a “TAX FACTS: True or False?” card series, each card correcting one common misunderstanding, ending with an invitation to a “Let’s Talk Taxes” open house.
Why it works: it treats a budget explainer as content design, not a document dump — and it is fully reusable, one card at a time.
How much to post — and where the ceiling is
There is no universal right number, and advice that gives you one is guessing. Typical volume scales with population: about 12 posts a month for a town under 10,000, 21 for a city of 10,000–50,000, and 29 for a large city or county.
More is not automatically better. Plotting per-post engagement against how much a government published that month shows a long flat stretch and then a cliff:
Two things to take from this. First, there is a lot of room before you hit the ceiling — engagement barely moves between 8 posts a month and 30. If you are posting twice a week and feeling behind, the data does not support the guilt. Second, the cliff is real and it is steepest for small towns: past roughly 45 posts a month, a small-town page’s median post drops from 6 interactions to 3.
The weekend gap
The cheapest win in the data. Local governments publish almost nothing on Saturday and Sunday — and those are the two best-performing days of the week.
The gap holds at every community size: small towns see a median of 5 on weekends against 4 on weekdays, mid-size cities 8 against 6, and large governments 12 against 8 — half again as much.
It also holds within most content types, so it is not simply an artifact of what happens to get posted when. Events posts do best of all on weekends (a median of 14 against 9 on weekdays), and community engagement, public safety, and infrastructure all gain. A few categories are flat — animal services, library and education, sustainability — and business posts do slightly worse. So the move is not “post anything on Saturday,” it is move one event, recap, or public-safety post to the weekend.
A month that works
Here is the mix above, laid out as a month for a mid-size city — about 20 posts, which is exactly the median for that size. Nothing here requires a bigger team; it is the same effort, pointed differently.
20 posts · 4 infrastructure · 4 public safety · 4 events · 4 weekend anchors · 3 procedural · 1 transparency
The proportions are the point. Infrastructure goes from 8.5% of a typical calendar to 20% here. Procedural notices still get posted — they are obligations — but they stop setting the tone of the page. And four posts land on weekends, where almost nobody else is publishing.
Where these numbers come from
Deeper dives, with full methodology: What an Engaging Month of Municipal Social Media Looks Like, What Local Governments Should Post on Facebook, the video analysis, and the best time to post.
Your next post is already written somewhere.
Search 5,000+ peer governments by topic and see what actually landed — then borrow it.
“An exceptional way for people to look for ideas and comparisons.”